
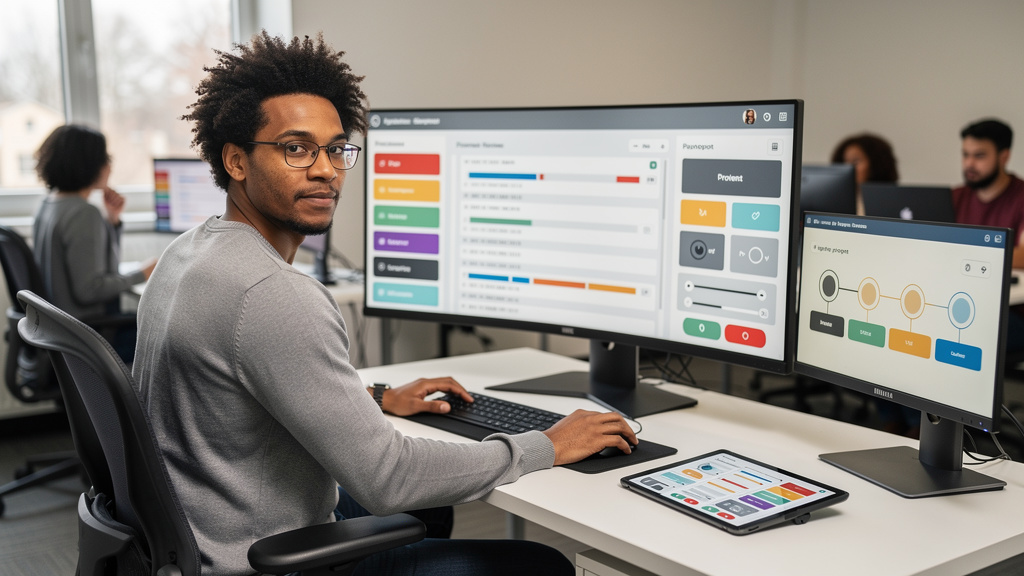
I spent a Saturday morning last month watching a senior SRE (site reliability engineer) work through a single slow page-load complaint. By the time the customer emailed us, the spike was already seven minutes old. The engineer clicked through four dashboards, opened one trace, and rolled back a model deploy that had started pushing 8-second responses where the previous build served them in 200 milliseconds. Total time on the laptop, about twelve minutes. I had been on that same team for two years before I understood why that speed was possible, and most of what made it work is invisible to anyone who has not had to wire it up.
Observability is the part of a data centre that the people using it never see. It is not a vendor pitch, and it is not a dashboard. It is a set of practices for turning the firehose of signals coming off thousands of machines into a small enough number of facts that a human, or an automation script, can make a decision. Most of the time nobody notices it is there. When it works well, you go home on time. When it does not, you do not.
The three lenses, and why you need all of them
The three pillars are not really pillars. They are three different lenses on the same system, and you need all of them. Metrics are the heartbeat: counters and gauges that tell you request rate, error rate, latency, CPU, memory, queue depth, and so on. They are cheap, sampled on a schedule, and good at answering questions that start with “how much” or “how many”. Prometheus is the open-source heavyweight that most teams reach for first, and VictoriaMetrics is a popular drop-in if you need to store more of them for longer.
Logs are the diary. Every application already produces them; the engineering question is whether you can find the one line that matters in the millions you did not need. The move over the last decade has been from free-form strings to structured JSON records with consistent fields, which lets you query for a user ID, a request ID, a particular error code, or a time window. Loki, Elasticsearch, and OpenSearch are the three storage systems you will hear about most. Each has trade-offs around cost, index overhead, and query speed, but they all solve the same problem of finding one log in a haystack quickly.
Traces are the youngest of the three and the one most engineers under-use. A trace follows a single request across every service it touches, recording how long each hop took and what each hop was doing. When something is slow, the trace usually tells you why in a way that metrics and logs cannot, because you can see exactly which span in the chain is the problem. Jaeger, Tempo, and Zipkin are the open-source systems to know. OpenTelemetry is the standard for emitting them, and most modern language runtimes have OTel libraries that handle the propagation for you.
You cannot get away with only one of these. Metrics tell you that error rates went up. They do not tell you which request or which line of code. Logs tell you what an application said at a specific moment. They do not tell you which downstream call was holding things up. Traces tell you the path and the timing. They do not tell you the value of a particular field at a particular moment. Each one fills a gap the others leave open.
SLOs and the error budget
SLOs are the part most teams put off until they have been burned badly enough to care. A Service Level Objective is just a number tied to something a user would notice: 99 percent of page loads under three seconds, 95 percent of search results returned within 500 milliseconds, the checkout API up 99.9 percent of the month. Once you have an SLO, you have an error budget. Once you have an error budget, the conversation about whether to ship a risky feature on Friday night becomes a math problem instead of an argument. Grafana has built-in SLO dashboards. Sloth is a small open-source tool that generates Prometheus recording rules for SLOs without much ceremony.
The reason any of this matters is that automation does not work without signals. A modern operations setup will drain a bad host, restart an over-budget service, scale out a region that is taking traffic, and roll back a deploy that is breaking things, all without a human. None of those decisions can be made safely unless the system can tell the difference between healthy and unhealthy in a way it can verify. That is what observability is for. The metrics, logs, and traces are the building blocks. The SLOs are the contract. The automation is the user.
A practical toolkit
If you are picking tools today, the practical starting set is short and open source:
- Prometheus for metrics. Pull-based, mature, the de facto standard. Pairs with Alertmanager for routing.
- Loki or Elasticsearch for logs. Loki is cheaper and simpler if you mostly grep; Elasticsearch is faster for free-text search at scale.
- Tempo or Jaeger for traces. Tempo stores traces in object storage and is cheap; Jaeger is older and more battle-tested.
- Grafana for the dashboard layer. Wires all three together, has SLO views built in.
- OpenTelemetry SDKs in your services. The only long-term safe bet for instrumentation. Anything else is a future migration.
None of these are the only option, and the right answer for a single engineer running a homelab is different from the right answer for a team of fifty running a global product. The point is that the open-source path is real, it is well-supported, and it scales further than most people give it credit for.
Trade-offs
Observability is not free, and three costs hit every team that adopts it.
Storage is the most visible. Prometheus stores every metric sample for every series. A small service might emit a few hundred series; a large one with traces can emit tens of thousands. Once you keep a month or a year of fine-grained data, the disk bill starts to look real. Sampling, aggregation, and tiered storage help, but they each push the cost somewhere else, and the somewhere else usually involves losing the resolution you wanted for some specific future incident.
Instrumentation work is the second cost. Writing the code that emits the spans and structured logs is rarely fun, and it is rarely prioritized over feature work. OpenTelemetry libraries have made this easier, but the manual work of deciding which spans matter, which log fields are worth keeping, and which metrics actually map to a user-visible outcome still falls on a person. Teams that skip this step end up with a platform full of half-instrumented services and dashboards full of misleading numbers.
Cultural drag is the third cost. Once the data is flowing and the alerts are firing, the SRE team becomes the bottleneck for every question about whether something is healthy. Sales asks if a customer complaint is real. Product asks if a feature is slow. Engineering leadership asks if the system can handle launch day. All of those questions funnel through the same dashboards, and the team that built the dashboards owns the answers. This is mostly fine until the question volume outruns the team.
For a team running a handful of services with modest traffic, most of this is overkill. A single Grafana dashboard against a local Prometheus, plus a handful of log search queries, will cover ninety percent of incidents. For a team running dozens of services across multiple regions with real customers and real money on the line, the question is not whether to build the observability stack but how fast you can get it done before the next outage.
Bottom line
If you are standing up a new service and have not yet instrumented it, start with OpenTelemetry. Emit metrics, structured logs, and traces from day one. The libraries are stable, the standard is real, and you will save yourself the painful migration later when you finally need traces and do not have them. If you are inheriting an existing system, pick the one observability tool your team already understands, get it running on one service end-to-end, and expand from there. The engineer I watched on Saturday was not clever. She had a stack that told her what was wrong, and that is the whole point.